
1. Introduction: How to Compare Dubai Projects Like a Smart Investor
If you want to compare Dubai projects like a professional investor, focus on three core metrics: price per square foot vs rental yield, area supply risk, and developer track record.
The most effective way to compare Dubai real estate projects is through a structured 10-point framework that evaluates financial returns, location fundamentals, and execution risk. Most buyers compare off-plan projects in Dubai solely by price — but smart investors weigh ROI potential, oversupply risk, and RERA-registered developer reliability before signing a single cheque.
This guide shows you exactly how to compare two Dubai off-plan developments side-by-side using data, not emotion. Whether you’re choosing between two towers or two communities, learning to compare Dubai projects systematically is what separates amateurs from pros.
Below is the complete framework used by institutional investors to evaluate Dubai property investments in 2026.
2. Why Most Buyers Compare Dubai Projects the Wrong Way
Let’s call a spade a spade — most people compare Dubai projects by flipping through glossy brochures, comparing unit prices, and picking the prettiest payment plan.
Here’s what they ignore:
- Developer handover delays and historical delivery timelines
- Service charge per sqft eating into net yields
- Area saturation and upcoming supply in the same community
The result? Poor ROI and capital stuck in oversupplied communities for years.
How Pro Investors Do It Differently
Professional real estate investors use a Dubai property comparison checklist with 10 quantifiable metrics — not gut feelings. They compare Emaar vs Damac based on construction track record, not just brand hype. They evaluate off-plan vs ready property Dubai data to find the sharpest entry point.
❌ Amateur vs ✅ Pro Investor Comparison Approach
Factor | ❌ Amateur Buyer | ✅ Pro Investor |
Price | Compares total unit price only | Analyzes price per sqft vs area average |
Payment Plan | Picks the longest plan | Evaluates post-handover risk vs ROI timeline |
Developer | Chooses biggest brand name | Checks handover history + RERA track record |
Location | “It looks nice on the map” | Studies DLD transaction volume + rental demand |
Supply Risk | Never checks | Monitors upcoming inventory in the micro-market |
Service Charges | Ignores completely | Calculates impact on net rental yield |
ROI Projection | Believes the brochure | Runs independent rental comps + resale data |
The framework below will show you exactly how to evaluate a Dubai real estate project using the same methodology institutional buyers use — no fluff, no guesswork, just numbers.
3. The 10-Point Investor Comparison Framework
Here’s how to compare Dubai real estate projects systematically. Each metric below includes benchmarks from Dubai’s 2026 market, so you can score projects objectively. Use this as your Dubai real estate project comparison sheet foundation.
1. How to Compare Dubai Projects by Price per Square Foot vs Projected ROI
Compare Dubai projects by ROI, not just sticker price—because a cheaper unit in an oversaturated area will bleed money faster than you can say “handover delay.” The average price per sqft Dubai in 2026 ranges from AED 1,200 to AED 2,500, depending on location and developer tier. Always calculate both gross yield and net yield after factoring in service charges, mortgage costs, and maintenance fees to get the real picture.
Here’s the calculation that separates amateurs from pros:
- Rental yield Dubai formula: (Annual Rent / Purchase Price) × 100
- Target benchmarks: 6-8% gross yield for off-plan properties; 4-6% for ready property
- Factor in capital appreciation Dubai trends—historically 5-7% annually in prime areas like Dubai Marina and Downtown
Don’t forget to cross-reference with actual Dubai Land Department (DLD) transaction data rather than developer promises.
🚩 Red Flags to Watch:
- Price per sqft 20%+ above area average without justifiable amenities or location premium
- Promised yields that don’t match DLD rental data for comparable units
- Developers who won’t provide historical rental performance from completed projects
- Projects in areas where supply pipeline exceeds 3 years of absorption rate
When you compare Dubai projects by price per sqft, you’re comparing apples to apples—but when you layer ROI analysis on top, you’re investing like the institutions do.
ROI Comparison Example: Project A vs Project B
Metric | Project A (Dubai South) | Project B (JVC) |
Purchase Price | AED 850,000 | AED 1,200,000 |
Unit Size | 700 sqft | 750 sqft |
Price per Sqft | AED 1,214 | AED 1,600 |
Expected Annual Rent | AED 55,000 | AED 72,000 |
Gross Rental Yield | 6.47% | 6.0% |
Service Charge/Year | AED 7,000 | AED 9,000 |
Net Rental Yield | 5.65% | 5.25% |
Capital Appreciation (5yr) | Moderate (4-5%) | High (6-8%) |
Total Projected ROI (5yr) | 33.25% | 36.25% |
Verdict | Lower entry, decent yield | Better location premium |
Bottom line: When you compare Dubai projects by ROI, Project B edges out despite higher price per sqft due to stronger appreciation potential and location fundamentals.
2. Compare Dubai Projects Using Location Score & Infrastructure Pipeline
Location isn’t just about prestige — it’s about future infrastructure, connectivity, and demand sustainability. A well-located project today in an emerging area can outperform an established one if the infrastructure pipeline is strong.
Score any location across these 5 criteria:
- Metro & highway proximity — within 500m of a metro station adds measurable rental premium
- Freehold areas Dubai status — confirm ownership rights, especially for foreign investors
- Upcoming infrastructure development Dubai — projects near Expo City Dubai expansion and Dubai South projects are seeing accelerated capital growth in 2026
- School, healthcare & retail accessibility — directly impacts tenant retention and resale value
- Golden visa property Dubai eligibility — AED 2M+ threshold; location affects which projects qualify
Quick Comparison Snapshots:
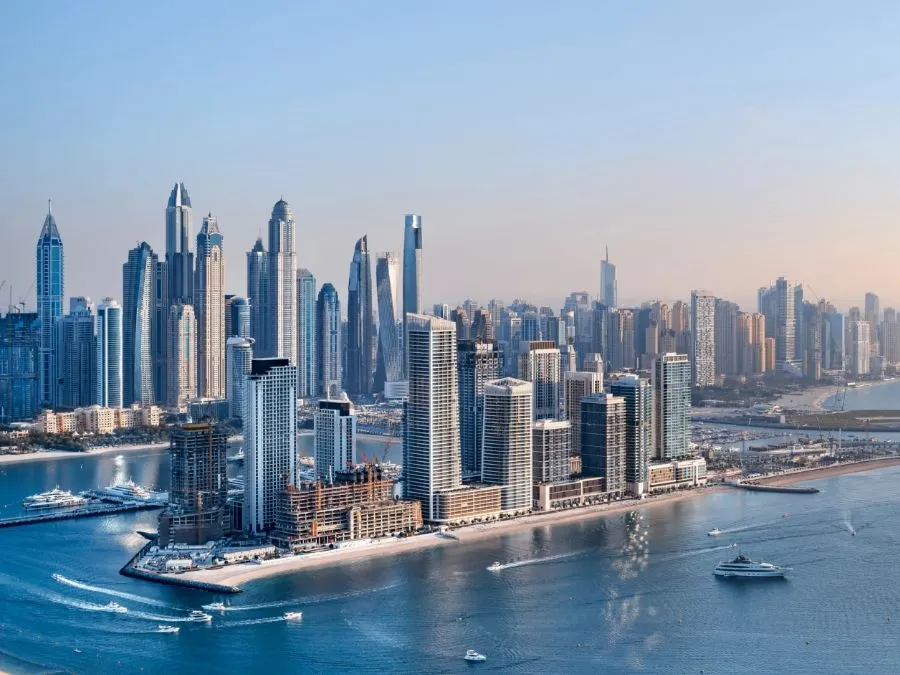
When you compare Dubai Marina vs Downtown Dubai investment, you’re weighing a mature, high-liquidity market against a globally iconic address with stronger capital appreciation upside. Both are proven — but entry prices and yield profiles differ significantly.
For emerging communities, JVC vs Dubai Hills is the classic yield-vs-lifestyle debate. JVC delivers stronger gross yields (7–8%), while Dubai Hills offers superior long-term appreciation and infrastructure maturity.
Location Scoring Matrix: Compare Any Two Dubai Projects
Location Criteria | Weight | Dubai Marina | Downtown Dubai | JVC | Dubai Hills |
Metro/Highway Access | 20% | 9/10 | 8/10 | 7/10 | 6/10 |
Freehold Status | 15% | ✅ 10/10 | ✅ 10/10 | ✅ 10/10 | ✅ 10/10 |
Infrastructure Pipeline | 25% | 6/10 | 7/10 | 8/10 | 9/10 |
School/Healthcare/Retail | 20% | 8/10 | 9/10 | 7/10 | 9/10 |
Golden Visa Eligibility | 20% | ✅ Yes | ✅ Yes | ⚠️ Select Units | ✅ Yes |
Total Score | 100% | 7.8 | 8.2 | 7.4 | 8.5 |
Scores based on 2026 market conditions and publicly available infrastructure data.
3. Supply Risk & Area Saturation
Oversupply kills ROI faster than anything else. Check current units under construction in your target area and compare supply and demand Dubai real estate data using DLD market reports.
Red flag indicators:
- Vacancy rate >15%
- Inventory pipeline >3 years of absorption
- Community completion <40% (nightmare for rental demand)
- 10+ similar projects launching simultaneously
How to check oversupply risk in a Dubai area:
- Review Dubai real estate market analysis 2025 and 2026 reports from property consultants
- Cross-reference best areas to invest in Dubai 2026 based on demand/supply ratios
- Avoid hype-driven areas where developers are flooding the market
Pro move: Communities with 60-80% completion offer the sweet spot—enough infrastructure for tenants, limited new supply competition.
4. Developer Reputation & Track Record
Your developer can make or break your investment. RERA registration is non-negotiable—if they’re not listed, walk away immediately. Beyond that, verify DLD registration and escrow account Dubai compliance to ensure your payments are protected.
What separates the pros from the pretenders:
- On-time handover history (check past 5 projects minimum)
- Construction quality post-handover (visit completed communities)
- Transparent escrow reporting and financial health
How to check if a Dubai developer is reliable:
- Search the official RERA developer list
- Compare promised vs actual handover dates on past projects
- Review completion certificates and customer feedback forums
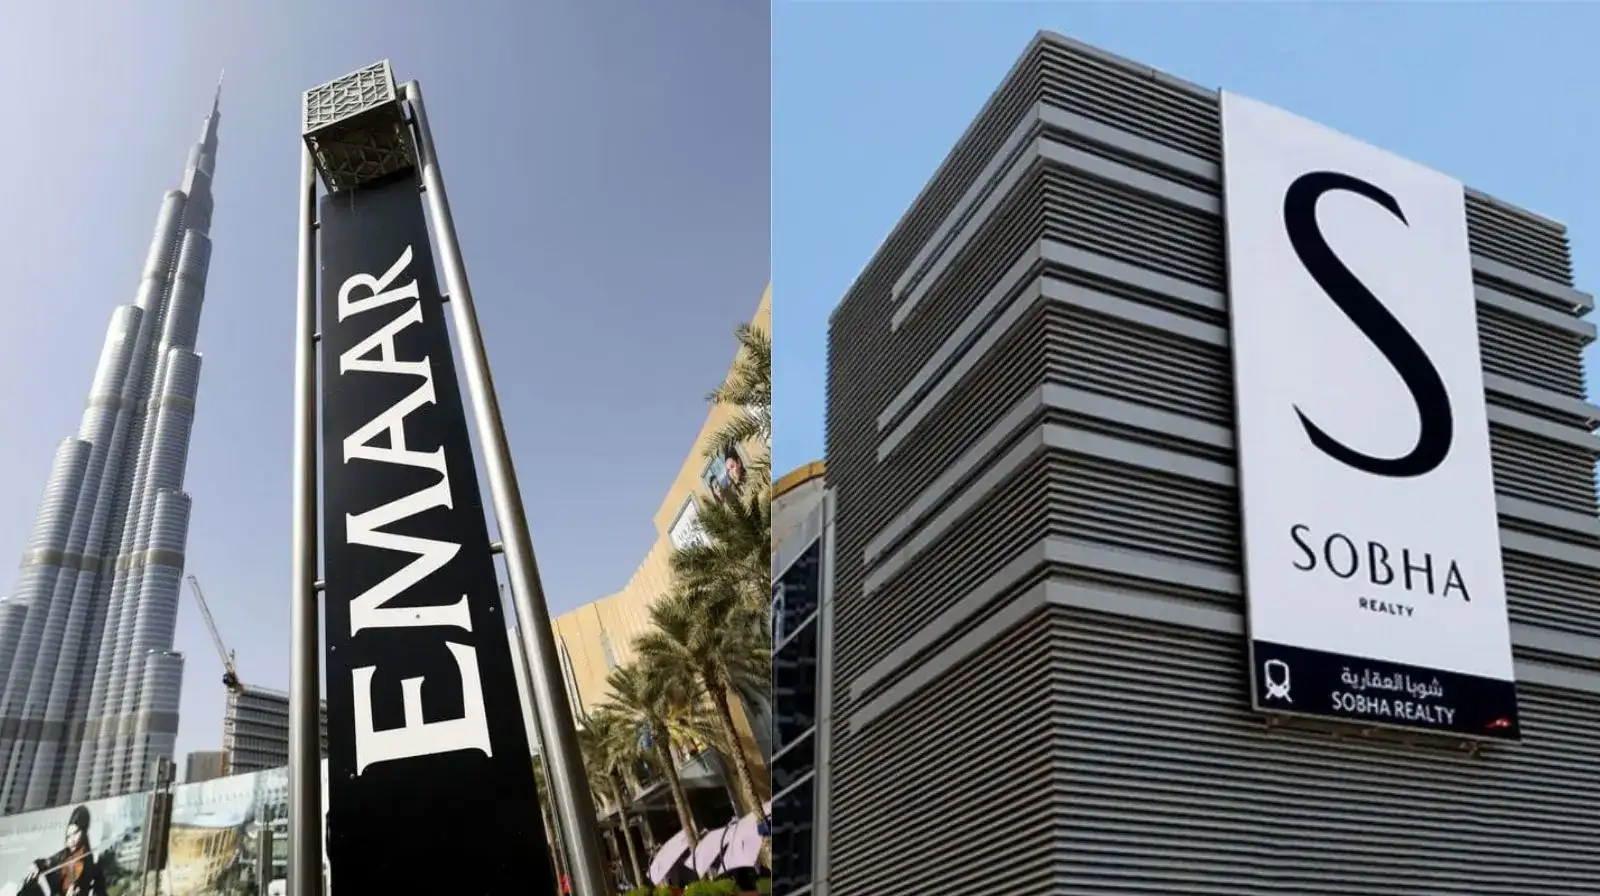
Real comparisons matter: When you compare Emaar vs Sobha Dubai, Emaar wins on scale and consistency, while Sobha excels in finishing quality. Wondering if Emaar is better than Damac? Emaar has a 92% on-time handover rate vs Damac’s 78% (2020-2025 data).
🚩 Red flags:
- No RERA listing
- 3+ delayed projects in portfolio
- Opaque escrow practices
Top 5 Dubai Developers: Track Record Scorecard
Developer | RERA Status | On-Time Handover Rate | Avg Delay (if any) | Escrow Compliance | Quality Score | Overall Grade |
Emaar | ✅ Verified | 92% | 2-4 months | ✅ Full | 9/10 | A+ |
Sobha | ✅ Verified | 88% | 3-6 months | ✅ Full | 9.5/10 | A+ |
Damac | ✅ Verified | 78% | 6-9 months | ✅ Full | 7/10 | B+ |
Nakheel | ✅ Verified | 85% | 4-7 months | ✅ Full | 8/10 | A |
Azizi | ✅ Verified | 72% | 8-12 months | ✅ Full | 6.5/10 | B |
Rating criteria: RERA status, handover punctuality, construction quality, customer satisfaction, financial transparency.
5. Construction Progress & Handover Timeline
In Dubai’s off-plan market, a promised handover date is a target, not a guarantee. Industry data shows the average Dubai project handover delay runs 6–12 months beyond the original timeline — factor this into your cash flow planning from day one.
What to verify before committing:
- Request current site photos and videos — not renders, not “artist impressions”
- Cross-check promised handover date vs realistic timeline based on current construction percentage
- Review project milestones achieved vs planned on the DLD project tracking portal
- Compare Dubai project handover delays across the developer’s existing portfolio — past behavior predicts future performance
🚩 Watch Out For:
- Projects with less than 20% construction completion but handover promised within 12 months
- Developers who won’t share live site updates on request
- Milestones consistently missed with no formal buyer communication
6. How to Compare Dubai Projects by Payment Plan Flexibility
Payment plans impact your cash flow and opportunity cost—compare payment plans Dubai projects beyond just the down payment percentage.
Key comparison points:
- Down payment: 10-20% standard (lower = higher developer risk often)
- Construction phase: Monthly/quarterly installments—fewer is better for capital deployment
- Post-handover payment plan Dubai: 1-5 year options reduce upfront burden
- Off-plan discount Dubai: Expect 10-20% below ready property prices
Sweet spot: 20% down, 30% during construction, 50% post-handover over 3 years.
Calculate this: A 5-year post-handover plan at 0% interest beats a 2-year plan if you can generate >6% returns elsewhere.
7. Community Master Plan & Amenities
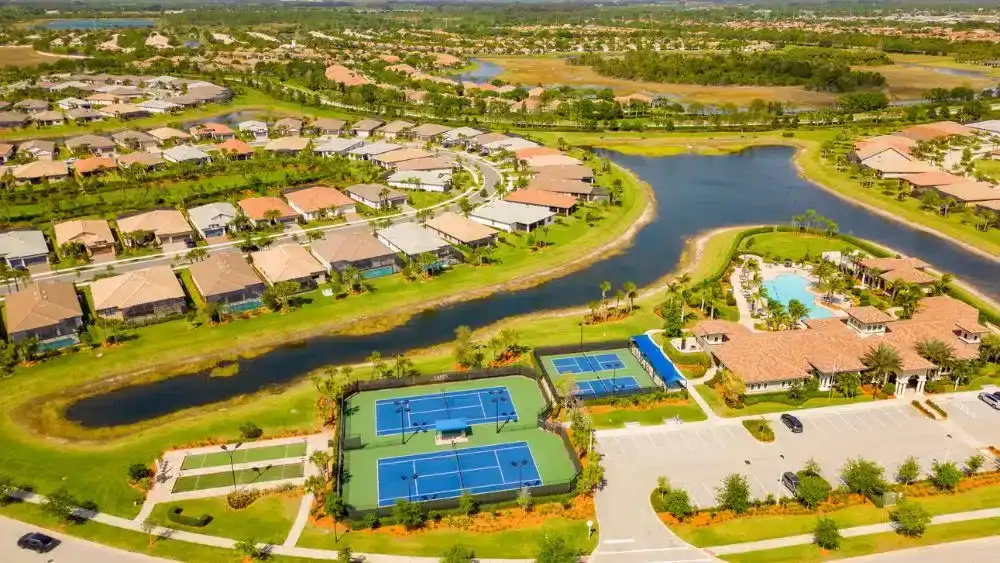
A stunning master plan brochure means nothing if the retail, parks, and community infrastructure are still a decade away from delivery. Evaluate the reality on the ground, not the vision on paper.
What to assess in any master community Dubai project:
- Current vs promised amenities — pools, gyms, parks, and retail outlets; what’s built today vs what’s “planned”
- Master plan completion timeline — a community that’s 70%+ built out offers far more rental stability than one breaking ground
- Branded residences Dubai — premium segment developments (think Bulgari, Armani, Six Senses) command 20–35% price premiums but offer stronger capital appreciation and global buyer demand
- Connectivity within the community — walkability, internal transport, and retail density directly impact tenant satisfaction and retention
Amenities Comparison: Standard vs Premium
Amenity Type | Standard Community | Premium/Branded | Impact on Rental Yield |
Swimming Pools | 1 shared pool | Multiple + infinity pools | +5-8% |
Fitness Centers | Basic gym | Spa + premium equipment | +3-5% |
Retail/Dining | Nearby options | Integrated F&B | +8-12% |
Green Spaces | Limited parks | Landscaped gardens + tracks | +4-6% |
Smart Home Tech | Basic | Fully integrated systems | +6-10% |
Branded residences Dubai justify higher price per sqft only if service delivery matches the name—verify operational hotels/residences by the same brand first.
8. Service Charges & Hidden Costs
Service charges erode net yields silently—compare service charges Dubai projects to reveal true ownership costs beyond purchase price.
Hidden costs that kill ROI:
- Service charge per sqft: AED 10-25/sqft/year (luxury projects hit AED 35+)
- Sinking fund: 2-5% of property value (one-time or annual)
- DLD fees: 4% transfer fee + AED 580 registration
- Maintenance reserves: Some communities charge extra levies
What are hidden costs when buying property in Dubai? Chiller fees, parking charges, move-in deposits, DEWA connections—add 5-8% to your first-year budget.
Calculate net yield accurately: AED 1.2M property with AED 18/sqft service charge on 800 sqft = AED 14,400/year ongoing cost.
9. Rental Demand & Tenant Profile
A unit that sits vacant is a liability, not an asset. Before committing, validate that real tenant demand exists in the area — not just developer-projected demand.
Key rental demand indicators to research:
- Occupancy rate Dubai: target areas with 85%+ occupancy — anything below signals weak absorption or oversupply
- Tenant demand Dubai drivers: proximity to business hubs (DIFC, Dubai Internet City, Dubai South), schools, hospitals, and retail directly correlates with lower vacancy periods
- Tenant profile matters: a community attracting young professionals vs families vs tourists each requires a different unit type, size, and furnishing strategy
How to calculate rental yield in Dubai accurately:
(Annual Rent ÷ Purchase Price) × 100 = Gross Yield [(Annual Rent − Annual Costs) ÷ Purchase Price] × 100 = Net Yield
The best investment property isn’t always in the most glamorous postcode — it’s in the area where tenants keep coming back.
10. Comparing Dubai Real Estate Projects: Exit Strategy & Resale Liquidity
Never buy what you can’t sell—secondary market Dubai liquidity separates smart investments from dead capital.
Exit planning essentials:
- Resale value drivers: Established developer, prime location, completed community infrastructure
- Capital appreciation timeline: 3 years minimum for off-plan appreciation; 5-10 years for optimal gains
- Liquidity test: Can you find 10+ similar units sold in the last 6 months? High transaction volume = easy exit
- Exit strategy real estate rule: Know your buyer before you buy (end-user vs investor market)
Liquidity ranking: Downtown Dubai/Marina = 2-3 months to sell; emerging areas = 6-12 months
Red flag: Communities with <5 transactions quarterly show poor liquidity—your capital gets stuck.
Pro move: Test liquidity before buying—search PropertyFinder/Bayut for recent sales velocity in your target community.
4. Real Example: Comparing Two Dubai Projects Side-by-Side
Theory is useful — but let’s put the framework to work. Below is a real-world walkthrough of how to compare two Dubai off-plan developments using all 10 metrics. This is the kind of Dubai project vs project comparison that separates instinct-driven buyers from data-driven investors.
We’ve selected two high-profile launches representing different investment profiles — one a master community play, the other a waterfront lifestyle asset:
- Project A: Emaar — Dubai Hills Estate (mid-luxury, master community, family-oriented)
- Project B: Damac — Dubai Harbour (premium waterfront, high-rise, investor-oriented)
Both are legitimate, RERA-registered developments. But when you compare Dubai apartment projects for investment using a scoring lens, a clear picture emerges.
Dubai Project vs Project: Full 10-Point Comparison Scorecard
# | Comparison Metric | Project A: Emaar – Dubai Hills | Score /10 | Project B: Damac – Dubai Harbour | Score /10 |
1 | Price per Sqft vs ROI | AED 1,450/sqft, ~6.8% gross yield | 8 | AED 2,100/sqft, ~5.9% gross yield | 7 |
2 | Location Score & Infrastructure | Established master community, metro planned | 8 | Prime waterfront, marina access, Sheikh Zayed Rd | 9 |
3 | Supply Risk & Saturation | Controlled supply, 75% community built out | 9 | Multiple competing waterfront launches nearby | 6 |
4 | Developer Track Record | Emaar: industry-best on-time delivery record | 10 | Damac: strong brand, mixed handover history | 7 |
5 | Construction Progress & Timeline | 65% complete, handover Q3 2026 | 9 | 40% complete, handover Q1 2027 | 7 |
6 | Payment Plan Flexibility | 80/20, limited post-handover | 7 | 60/40 post-handover over 3 years | 9 |
7 | Community Master Plan & Amenities | Golf course, schools, hospital, retail mall | 10 | Marina, beach club, retail promenade | 8 |
8 | Service Charges & Hidden Costs | AED 14/sqft — transparent RERA approved | 9 | AED 22/sqft — premium amenities reflect cost | 6 |
9 | Rental Demand & Tenant Profile | Strong family demand, 89% occupancy area avg | 9 | Strong short-term rental demand, 84% occupancy | 7 |
10 | Exit Strategy & Resale Liquidity | High liquidity, proven resale market | 9 | Moderate liquidity, still maturing market | 7 |
TOTAL INVESTMENT SCORE | 88/100 | 73/100 |
What the Scores Tell You
Project A (Emaar – Dubai Hills): 88/100 The stronger all-round investment for yield-focused and long-term investors. Lower entry price per sqft, superior developer track record, mature community infrastructure, and lower service charges make this the more predictable, lower-risk asset. Ideal for investors targeting stable rental income + capital appreciation over a 5–10 year horizon.
Project B (Damac – Dubai Harbour): 73/100 Not a bad investment — but a different risk-reward profile. The waterfront premium commands higher entry costs and service charges, with a less proven resale market. However, its flexible post-handover payment plan and marina lifestyle appeal make it attractive for investors targeting short-term rental income (holiday homes/Airbnb) or high-net-worth tenant profiles.
This is exactly how to compare Dubai villa projects and apartment projects for investment — score every metric, weigh what matters most to your strategy, and let the data lead the decision.
5. Conclusion: Compare Dubai Projects Like a Pro — Every Time
Knowing how to compare Dubai projects using data rather than marketing promises is what separates successful investors from those stuck with underperforming assets. Price alone never tells the full story — but 10 well-scored metrics always do.
Download the free Dubai project comparison sheet from Map Homes Real Estate and apply this framework to any development you’re evaluating. The team at Map Homes works with serious investors daily — helping them cut through the noise and identify projects that genuinely deliver.
Remember: the best investment isn’t always the cheapest — it’s the one that scores highest across all 10 categories.
Frequently Asked Question
Use a 10-point framework evaluating price per sqft, ROI, location, supply risk, developer reputation, construction progress, payment plans, amenities, service charges, and rental demand. Score each category 1-10 and compare totals.
Average Dubai price per sqft ranges AED 1,200-2,500 depending on location. Compare against area averages—premium locations like Downtown command AED 2,000+, while emerging areas like Dubai South average AED 1,200-1,500.
Verify RERA registration, check DLD records for escrow compliance, review past project handover dates, and compare developer track records. Reputable developers like Emaar and Nakheel have 90%+ on-time delivery rates.
Dubai property typically yields 5-8% gross rental returns. Net ROI after costs averages 4-6%. Off-plan projects often offer better entry prices with 10-20% discounts versus ready properties.
Off-plan offers lower entry prices, flexible payment plans, and higher appreciation potential. Ready properties provide immediate rental income and no construction risk. Choose based on your timeline and risk tolerance.
Review DLD supply data, check if >3 years of inventory exists, monitor vacancy rates (>15% indicates oversupply), and analyze community completion percentages. Avoid areas with 10+ concurrent launches.
Evaluate location infrastructure, supply-demand balance, developer RERA registration, payment plan flexibility, service charges, rental demand, and exit strategy. Use a Dubai property comparison checklist for systematic evaluation.